Calculating zonation and lithology models
After creating composite logs you can proceed to define the zonation model using the Lithology Model form (1D Model > Lithology > Lithology Model Definition > Lithology Model). This process involves using the Zonation Model view in tandem with the Lithology Model form to create the definition. The zonation can be calculated automatically, if supporting data is present, or manually. The lithology model source can also be based on the composite logs that were created earlier or on an imported lithology log. To aid you in this modeling process, the Zonation Model form, which can be opened from this form by clicking the Show button at the bottom of the form, provides tools that you can use to fine-tune the zonation segments and assign rock types. Optionally, you can use the Master Log Lithology tool to create a custom lithology model based on a master log image file.
To calculate the zonation and lithology models
- Open the Zonation Model view (1D Model > Lithology > Show View) so that you can see the change to the zonation model take effect as they are made.
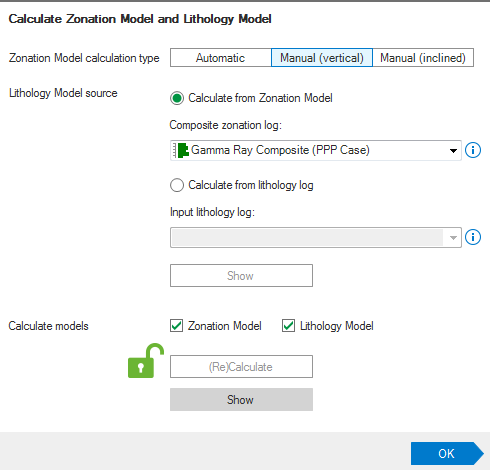
- Open the Lithology Model form (1D Model > Lithology > Lithology Model). On this form you will define the zonation model and can access other tools to fine tune the zonations.
- Choose the calculation type, Automatic or Manual (vertical) and Manual (inclined). The selection here depends largely on the availability of markers and a wellbore schematic, as well as the manner in which you want to handle the lithology definition.
- Automatic This option uses the markers and the wellbore schematic as inputs to calculate the zonations.
- Manual (vertical) For wells with a vertical trajectory, if marker and/or wellbore schematic data is unavailable, or if you prefer to create the zonations by hand, select Manual (vertical). This will allow you to create custom zones by clicking and dragging selection boxes in the Zonation Model track. For more, see Automatic versus Manual calculation below.
- Manual (inclined) If you are building the model for an inclined well, you can select this option and interpret the zones using the custom trend editor
 . See Automatic versus Manual calculation below for more information.
- For the lithology model source choose one of the composite logs or a lithology log. When using a lithology log you may also need to specify the rock type classes. For this, see Using a lithology log as the model source below. After you have selected a log as the lithology model source it will appear in the Zonation Model track in the Zonation Model view.
- Click Show, just below the (Re)Calculate button, to open the Zonation Model form where you can define the low, high and discriminator values for the selected zonation log, and lithology types for each zonation.
- At the Calculate models step, click (Re)Calculate to calculate the zonation and lithology model values.
- Optionally, you can calculate a separate lithology log based on your work with the zonation model. This lithology log is created using the Lithology Log form (1D MODEL > Lithology > Tools > Lithology Log). The lithology log calculation is based on the gamma ray discriminators in the Zonation Model and updates (depending on your auto update settings) each time one of the discriminators is adjusted. If you have used the Master Log Lithology tool to create a lithology model, the lithology model is used as input. After it is calculated, click Show on the form to add the output lithology log to the Zonation Model view.
- When you have finished creating your lithology model, click OK to proceed to the Rock Properties form, where the rock type logs can be calculated.
Automatic and Manual calculation of zonation segments
Depending on your available data you will select either Automatic or Manual calculation.
- Automatic The zonation model is calculated based on the existing marker and well schematic information. This method applies a lithology discriminator that determines the lithology type over the depth interval of the zone; the discriminator is applied vertically to the data. This discriminator, and the 0% and 100% shale volume bounds, can be changed in the Zonation Model track by clicking and dragging them to the desired position if you feel an adjustment is needed. You can find more information on the Zonation Model track in the Zonation Model view topic. Whether the lithology column automatically updates depends on the Automatic Update settings, which are defined on the Auto-Update Settings form or by clicking the lock icons on the Lithology Model form to turn auto-updates on or off.
- Manual (vertical) For vertical wellbores, zonation segments are created by hand by clicking and dragging a box in the Zonation Model (similar to the manner in which you compose logs). After drawing the box around the area that you want to create a zone from, double-click the selection box to form the new zonation segment. The new segment will appear on the Zonation Model form, where you can review and fine-tune the segment settings. The Zonation Model form can also be used to create zones, instead of using the graphical interface, by specifying the start and stop depths for the zone. Like the Automatic approach, a lithology discriminator is applied to the entire zone when it is drawn to determine the lithology type of the zone, and runs vertically through the data.
- Manual (inclined) For inclined wellbores, an approach that applies a vertical lithology discriminator to your data may not make sense or may fail to produce an accurate lithology representation, due to the trajectory of the wellbore. To handle this, the Manual (inclined) mode allows you to draw custom lines through your data in the Zonation Model track. To create your interpretation, select the Manual (inclined) mode and begin by clicking in the track where you want to begin your custom line, then click to add turning points as you interpret down the data. A double click signals the end of the line. You can also click and drag the individual nodes to reposition them, if necessary. You may draw as many lines as needed. Note that if you draw or adjust a line so that it overlaps an existing line, the application will account for this and adjust the existing line to avoid the occurrence of an overlap. These custom lines serve as both the extent of the zone and the discriminator; a zone is created for each custom line you draw in the track. The image below exhibits and example interpretation of the discriminator line, and the corresponding zones that are created and defined in the Zonation Model form.
-example.png)
This scenario produces four different zones, each with its own discriminator value. click to enlarge
Defining a new zonation interval
As stated in the description of step 3 above, you can create a new zonation interval when you select the Manual calculation type.
Manual zone creation in the Zonation Model view.
To create a new interval you need to select the Manual option on the form, then click and drag a selection box (in the same manner in which you drag a selection box while composing logs) in the Zonation Model track at the depth you want the new segment created.
Once you are satisfied with the selected depth range, double-click anywhere within the interval to create a new zonation interval. A prompt appears, asking you to confirm that the existing zonation is overwritten with the new selection. In the Zonation/Segment Settings section on the form you can find the new segment labeled 'Zonation'. Note that the Start and Stop MD and TVD of the affected zonations are automatically adjusted upon creation of the new interval.
Creating a new interval in the Zonation Property Settings table
When the calculation type on the Lithology Model form is set to Manual, you can create a new zonation interval in the Zonation Property Settings table. First, determine the depth range at which you want the new zonation and then right-click on the zonation that resides above or below this new interval. For example, in the image below showing a number of existing zonations if you want a new zonation at the bottom of Formation C (1941.53 MD), right-click the Formation C row and select Insert zonation below.
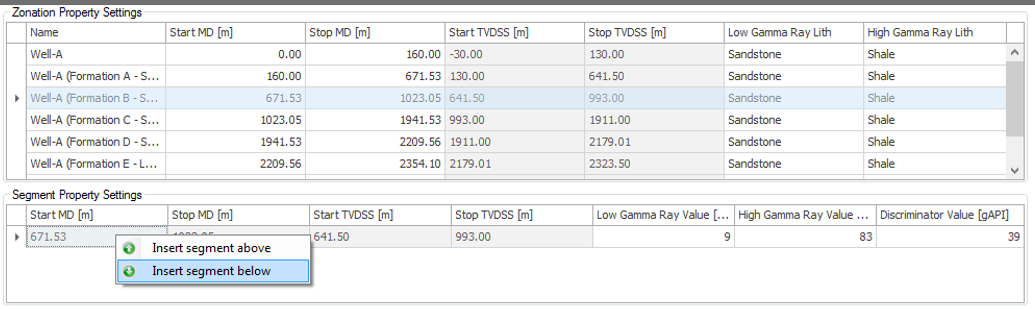
Manual zone creation in table.
Using a lithology log as the model source
Lithology logs created outside of the application can be imported just as any other log, via the Static Data sub-strip, and can also be created using the Property Calculator. When importing a lithology log, ensure that the lithology data type is assigned during the import process, otherwise, the log will not appear for selection on the Lithology Model form. If a lithology log has already been imported but has not been properly assigned, find the log in the JewelExplorer, click it and change the Property Type in the Inspector to Lithology.
When using a lithology log on the Lithology Model form, select it and then click the adjacent Show button to open the Lithology Property Editor. In this dialog you can associate the log classes with the rock types in your solution. This is a vital step, as no associations are assumed upon the import of the log and, therefore, no associations between log classes and rock types are automatically created.
Automatic updates in the Zonation Model
Whether the zonation, cut-off values and lithology column automatically update depends on the Automatic Update settings.
- If the lock icon is colored green and in the ‘unlocked’ position, updates to the zonation model, including the cut-off values, lithology column and Vshale are immediately applied and reflected if the zonation or cut-off values are modified.
- If the lock icon appears blue and ‘locked’, changes to the zonation, cut-off values, lithology column and Vshale values do not automatically update. If changes are made the lock icon turns red, which means you must click (Re)Calculate to update your model with the changes.
- If a new log for the model source is selected, an update in the track must occur by right-clicking in the Zonation Model track and selecting Recalculate cutoffs to show the default discriminator and the 0% and 100% cut-off values of the new log.